


/ Blog
Black Friday Analysis: 8 Metrics to Increase Conversions for BFCM 2020

Asiya Nayeem
Content Marketer
- DATE PUBLISHED (23/10/2020)
- READ TIME (5MIN)


Gearing up for the last leg of your Black Friday planning? With your discounts, marketing collateral, and support systems set up, we’re sure that you’re almost ready to launch.
But before you roll out your BFCM 2020 campaign, there’s something you’ll need to check.
For a successful sale weekend, you’ll need to forecast and minimize issues that are likely to add friction during the sale and might put off your customers from buying. And that’s where Google Analytics comes in handy.
Your past data can be very telling of what shoppers prefer, how they shop during this sale period, and how you can optimize your strategy. By using your data to improve the on-site experience and your marketing campaigns, you can find areas of opportunity to sell more, capture more purchases during Black Friday, and optimize the customer journey for a frictionless shopping experience.
We’re here to help — so let’s get to it. In this guide we’ll look at two types of data and how to use them to optimize your store for Black Friday:
1. Past Black Friday data: We’ll look at data from previous Black Friday sales to understand customer expectations during this sale period, how they interact with your store, and which marketing channels work best during this time.
2. Real-time data: On the other hand, customer preferences and behaviors are constantly changing, especially with the shift in shopping trends this year. So, we’ll also leverage data about real-time shopper behavior to understand which products are trending on your store and issues in your checkout.
Note: When analyzing data from your past Black Friday sale, use the date picker to define the time period.
8 Metrics From Your Google Analytics Dashboard To Improve Black Friday Conversions
1. Analyze channels that brought in traffic and conversions.
Past Black Friday data
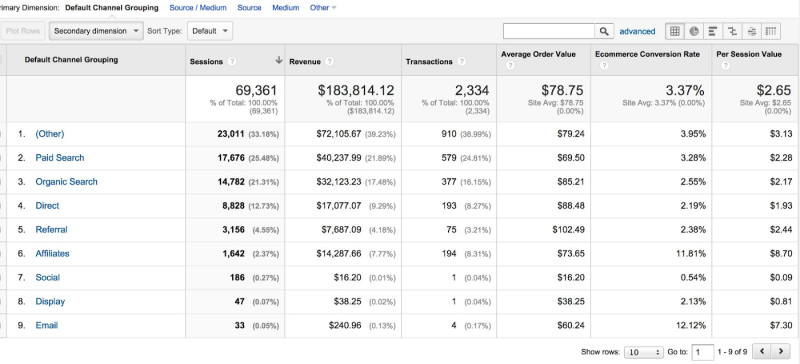
For starters, understanding how different channels impact your Black Friday traffic and conversions can help you with a few crucial insights.
High Performing Channels: Track these and aim to replicate their success in your current sale. Plan more campaigns with these channels to maximize your reach.
Poorly Performing Channels: Understand which channels performed poorly so you can avoid the mistakes you made and optimize them for better results.
High-Value Channels: Find which channels bring your high-value shoppers. Using this insight, you can adapt your communication accordingly.
In the example below, you may find that there were fewer affiliate shoppers who visited but the return on these shoppers was higher than other channels. So, using this insight, you can plan more influencer marketing activities ahead of Black Friday.
2. Single out marketing campaigns that brought in higher sales
Past Black Friday data
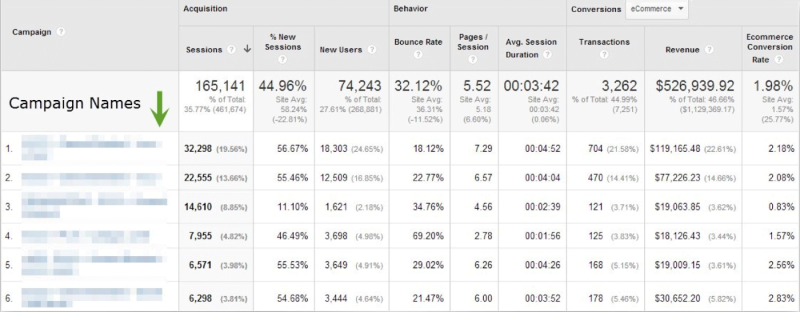
Besides comparing different channels and their impact on your Black Friday sales, you can dig a little deeper to understand which specific campaign or messaging worked best for shoppers. Drilldown on your channel grouping to compare different campaigns within specific channels. You may find that an SMS promotion that used questions within its copy had higher clicks than a promotion that just lists down the discount being provided.
This strategy is especially helpful for your email campaigns. Compare all your email campaigns to understand the traffic and conversions they brought in, and which emails had higher order values. Use these insights to learn what kind of messaging works for your shoppers, what kind of subject lines are better received, and the kinds of copy tactics that convert best.
3. Study how shoppers across different devices converted.
Past Black Friday data
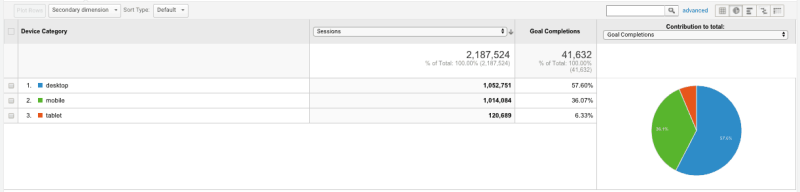
Do you know which devices your shoppers use to access your eCommerce store? While there is a shift to mobile shopping, different stores see different device uses. Analyze and anticipate the different devices your shoppers are likely to use, cater to these different shoppers, and double-check if your store functions smoothly across these (and more) devices.
One common problem that many eCommerce stores witness is that some offers or pop-ups aren’t viewable on certain devices. You don’t have to test your on-site experience on every device. Instead, figure out which device brings in sizable traffic and test your eCommerce store on these devices to check if there are any issues and if your store is fully functioning for shoppers using this device.
4. Understand user behavior to identify drop off patterns
Past Black Friday data & real-time data
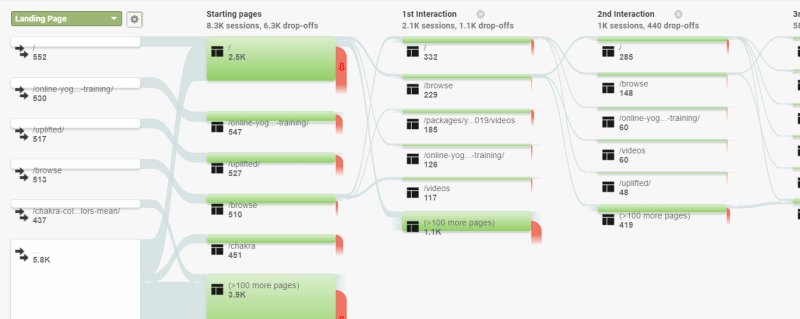
The Behavior Flow page on your Google Analytics dashboard shows you how exactly shoppers interact on your store, including where they drop off. You can look at this flow to understand which pages saw higher drop-offs and how to get shoppers to checkout faster.
Compare how shoppers interacted with your store during your last Black Friday in comparison to your current behavior flow. This can give you an idea of the expectations and issues that BFCM shoppers face (like wanting a faster checkout or dropping off at search) versus how shoppers have interacted with your store in the past few months (like wanting to read about your hygiene standards before they start shopping).
When you find specific product or collection pages with higher drop-offs, analyze the content and CTAs, look for errors or friction from a customer’s perspective, and find ways to increase engagement on these specific pages.
5. Implement insights from 2019 on your BFCM landing page.
Past Black Friday data
If you set up a landing page for Black Friday last year, you can look into how customers navigated through this page, buttons/sections that were commonly clicked on, and where you were losing their interest.
Plan changes on your new Black Friday landing page based on these insights — like placing product recommendations higher up on the page or showing a CTA below specific parts where customer intent is higher.
There are 2 ways to understand how shoppers interact with your BFCM landing page.
Behavior Flow: Specify the Black Friday landing page in the ‘Behavior Flow’ section to note how shoppers interact on the page. You’ll be able to track clicks on the page and assess popular products and collections.
Heat Map Tools: You can also use a heat map tool like Hotjar or Google’s Page Analytics extension to understand which parts of your Black Friday landing page had higher engagement and where you lost shoppers.
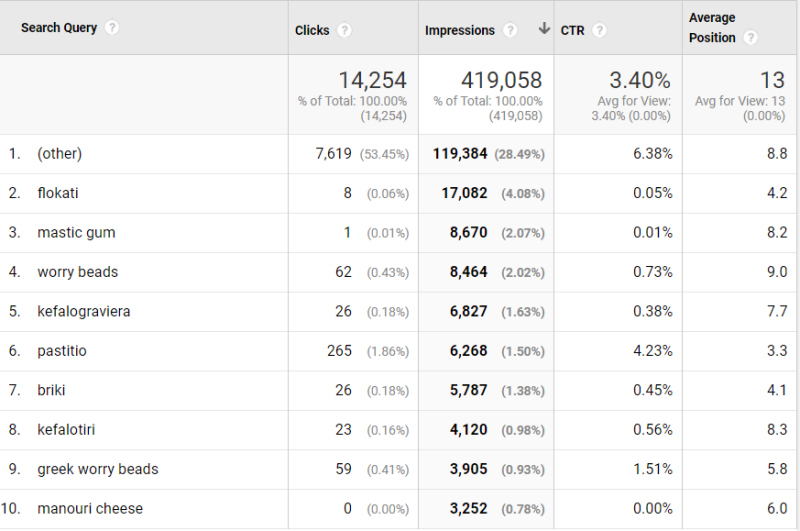
6. Dive into organic search data to see what’s working.
Past Black Friday data
Organic search is a very important component of inbound traffic, and understanding historic and current trends and identifying the keywords that work for you can be a dealbreaker for a successful campaign. Keep an eye on the clickthrough rate (CTR) while picking the right terms.
Here’s how this helps:
Capture Uncommon Keywords: If shoppers have used uncommon keywords to find your products, include them as synonyms within your on-site search.
Use Keywords By Intent: Optimize product pages well (don’t forget alt tags for images!), in line with popular keywords. For longer keywords like “gym equipment for sale”, create blog posts bundling different products to rank better.
Build Product Comparison Pages: Use product comparison pages (your product vs your competitor’s product) to rank better for competitive keywords. Customers prefer comparing products before purchasing them, so this is essential.
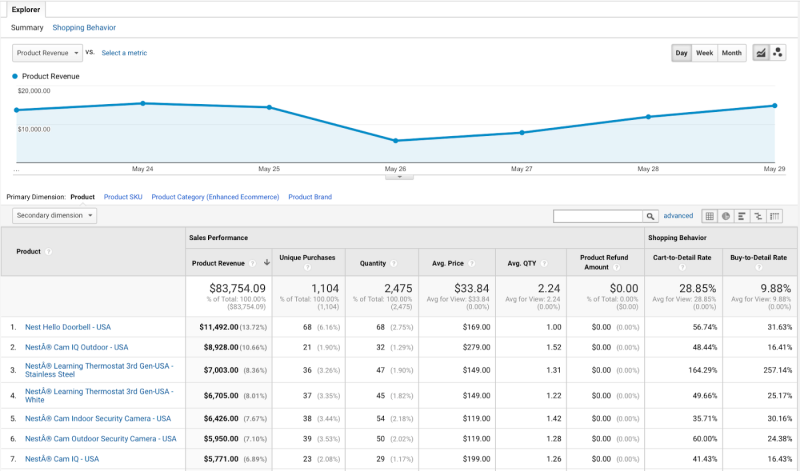
7. Bundle popular products for improved AOV.
Real-time data
There has been a major shift this year in how consumers shop.
It’s safe to say that last year’s bestsellers may not click with shoppers this year. Analyze your product sales from the past two months to position your catalog better. Keep an eye out for recent trends (and seasonal trends) in your product sales, and amp up the visibility to these popular products to convert shoppers faster.
For instance — if you are a home decor brand, you might see more shoppers buying new sheets or ornaments to start their Christmas shopping early. Position these products as recommendations on your storefront to maximize sales.
Unlock insights from your product analytics to plan bundles and cross-sell recommendations based on popular pairings. Position your product bundles in a way where customers can visualize the value and are incentivized to pick them up.
Use recommendations to strategically increase the AOV on your store.
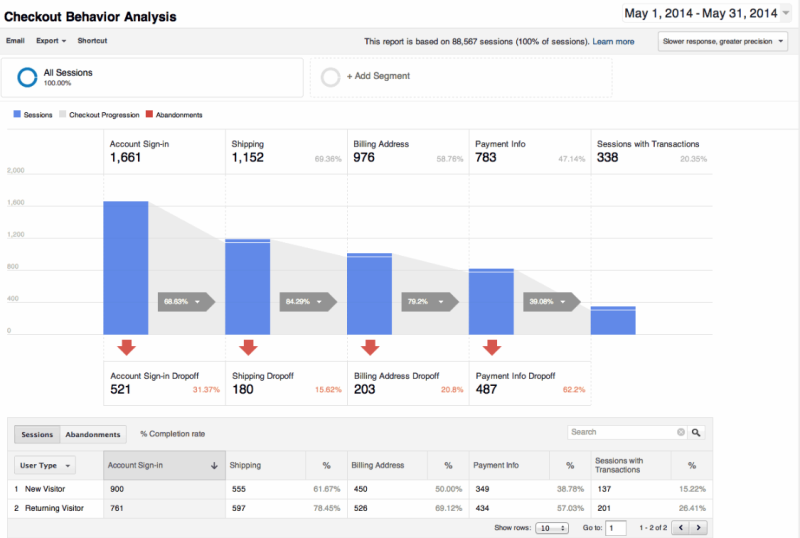
8. Optimize the checkout experience for reduced friction.
Real-time data
The checkout flow is the most important part of the customer journey. Shoppers have different reasons for dropping off your store during checkout, from hesitation over data security to unexpected shipping rates.
Troubleshooting this checkout behavior can help you lower abandonment rates.
For instance, if you have higher drop-offs for account sign-in, you could enable a one-click sign-up that lets shoppers use their existing social profiles to register.
This reduces friction and gets shoppers to checkout faster. Use guest checkouts, social profiles, and express checkout options to improve the checkout experience.
Pro Tip: If you sell high-value products, offer attraction EMI options during checkout.
You’re now all set and ready for the BFCM sale!
Your store data is a goldmine of information about your customer preferences and expectations, so it’s important to learn how to use them wisely.
Stay tuned to our blog for more insights on how to leverage Google Analytics to transform your business.